
Punnett Square Calculator
- Khan Academy — Mendelian genetics & Punnett squares
- Wikipedia — Punnett square (overview & history)
A capital letter and a lowercase letter can describe very different inheritance outcomes. The Punnett Square Calculator combines the alleles from two parents and displays the expected offspring genotypes, genotype probabilities and dominant or recessive phenotype proportions for a simple one-gene cross.
This model is designed for introductory Mendelian genetics. It assumes one gene with two alleles—A and a—and complete dominance, where one copy of the dominant allele is enough to produce the dominant phenotype.
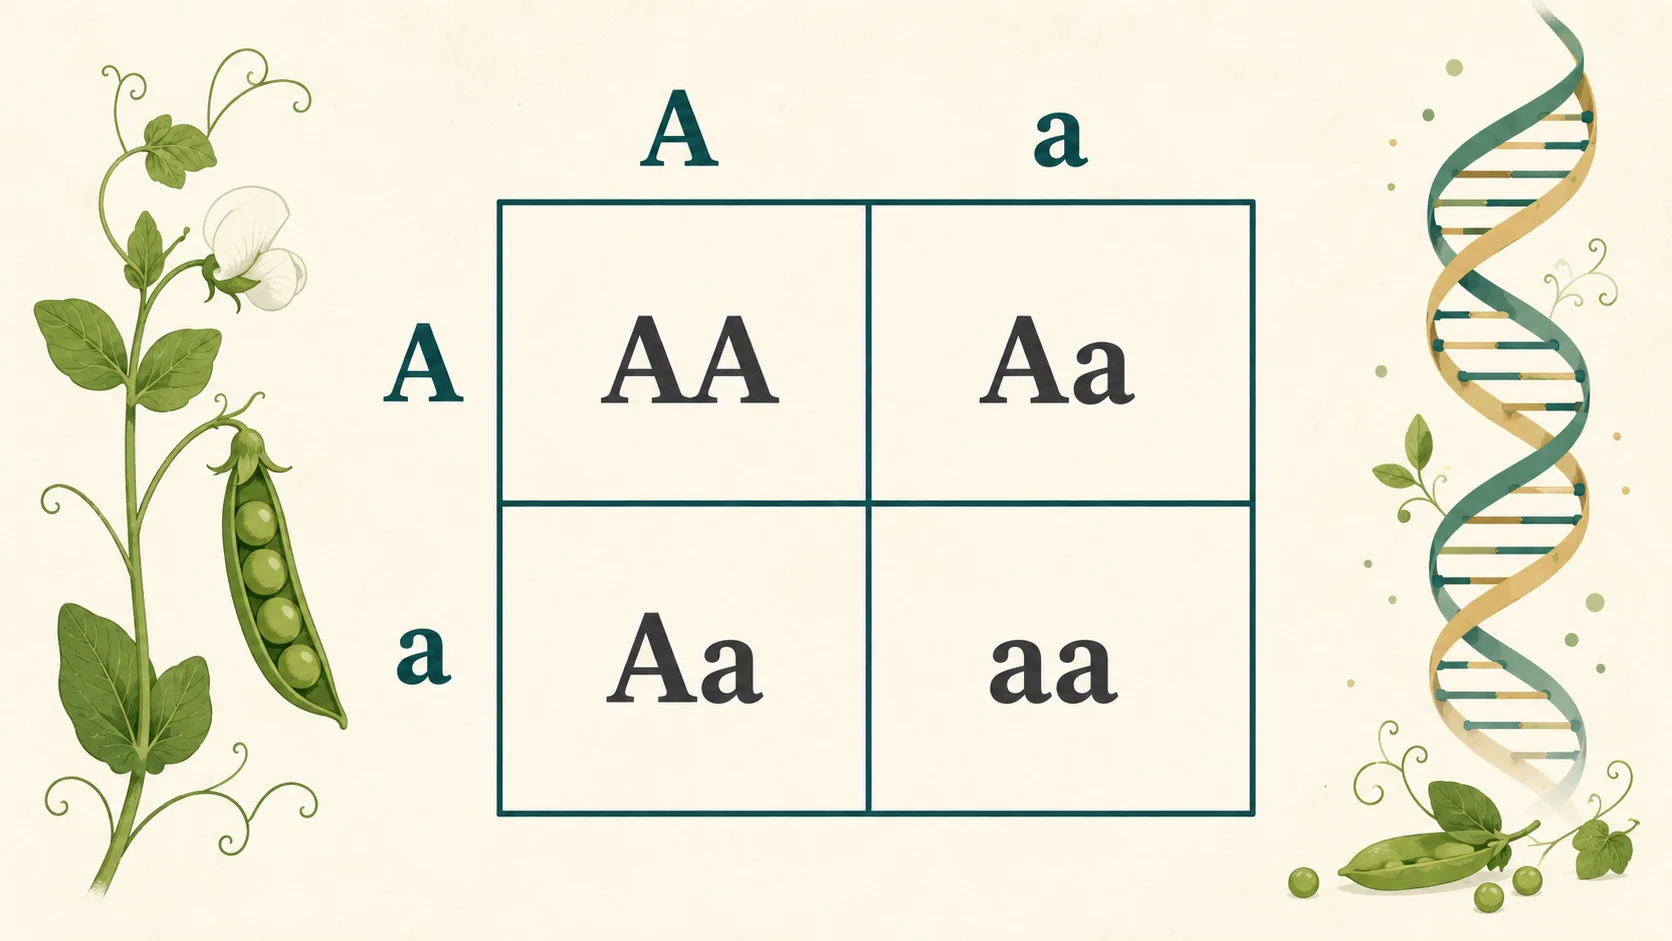
How the Punnett Square Calculator Works
Each parent passes one allele to each offspring. The calculator identifies the alleles that can appear in each parent’s gametes and combines them in a 2 × 2 grid. Every cell represents one possible pairing of parental alleles.
| Parent genotype | Possible allele contribution |
|---|---|
| AA | A only |
| Aa | A or a |
| aa | a only |
The grid cells are counted to calculate the expected percentages for AA, Aa and aa. Under complete dominance, AA and Aa share the dominant phenotype, while aa has the recessive phenotype.
How to Enter the Parent Genotypes
- Select AA, Aa or aa for the mother’s genotype.
- Select the corresponding genotype for the father.
- Review the live probabilities for AA, Aa and aa offspring.
- Check the phenotype overview for dominant and recessive proportions.
- Read the generated Punnett square and detailed tables.
- Select Reload or Reset before starting a different cross.
For the simple autosomal model represented here, reversing the two parents does not change the expected probabilities. For example, AA × Aa and Aa × AA produce the same result.
Genotype and Phenotype Meanings
| Term | Meaning in this calculator |
|---|---|
| Allele | One version of a gene, represented here by A or a. |
| Genotype | The allele pair inherited by an offspring: AA, Aa or aa. |
| Phenotype | The observable trait category predicted from the genotype under the assumed dominance pattern. |
| Homozygous dominant | AA: two copies of the dominant allele. |
| Heterozygous | Aa: one dominant and one recessive allele. |
| Homozygous recessive | aa: two copies of the recessive allele. |
Worked Example: Aa × Aa
In a cross between two heterozygous parents, each parent has an equal chance of contributing A or a. Combining those alleles gives this square:
| A | a | |
|---|---|---|
| A | AA | Aa |
| a | Aa | aa |
The four equally likely cells produce:
- AA: 1 out of 4, or 25%
- Aa: 2 out of 4, or 50%
- aa: 1 out of 4, or 25%
The expected genotype ratio is 1 AA : 2 Aa : 1 aa. With complete dominance, three cells show the dominant phenotype and one shows the recessive phenotype, producing an expected 3:1 phenotype ratio.
Monohybrid Cross Results Reference
| Parent cross | Expected genotypes | Expected phenotypes |
|---|---|---|
| AA × AA | 100% AA | 100% dominant |
| AA × Aa | 50% AA, 50% Aa | 100% dominant |
| AA × aa | 100% Aa | 100% dominant |
| Aa × Aa | 25% AA, 50% Aa, 25% aa | 75% dominant, 25% recessive |
| Aa × aa | 50% Aa, 50% aa | 50% dominant, 50% recessive |
| aa × aa | 100% aa | 100% recessive |
Probabilities Are Not Guaranteed Counts
A probability describes the expected chance for each offspring, not the exact composition of a small family or litter. An Aa × Aa cross does not guarantee that every group of four offspring will contain exactly one AA, two Aa and one aa.
Each fertilization is a separate event. Larger numbers of offspring may approach the predicted proportions, but random variation can produce different observed counts.
Assumptions and Limitations
- The calculator models one gene with two alleles.
- It assumes complete dominance of A over a.
- It does not model incomplete dominance or codominance.
- It does not account for sex-linked inheritance, multiple alleles, gene linkage, lethal alleles or mutations.
- It cannot represent polygenic traits influenced by many genes.
- Environmental effects, penetrance and variable expression are not included.
This educational Punnett Square Calculator should not be used to diagnose a genetic condition, interpret personal DNA results or estimate an individual family’s medical risk. Human inheritance can involve factors that are not represented by a basic monohybrid square. Questions about medical genetics should be discussed with a qualified genetics professional.
Frequently Asked Questions
What does a Punnett square predict?
It predicts the possible allele combinations and their expected frequencies for offspring when the parents’ genotypes and inheritance model are known.
What is the difference between genotype and phenotype?
Genotype is the inherited allele combination, such as Aa. Phenotype is the observable trait category associated with that genotype under the assumed inheritance pattern.
Does a dominant allele mean it is stronger or more common?
No. Dominant means that one copy can influence the phenotype in a heterozygous genotype. It does not automatically mean the allele is healthier, stronger or more frequent in a population.
Why does Aa appear twice in an Aa × Aa square?
A heterozygous offspring can inherit A from the first parent and a from the second, or inherit a from the first and A from the second. Both routes produce Aa.
Is a 25% result guaranteed once in every four offspring?
No. The 25% applies independently to each offspring. Actual results in a small number of offspring can differ from the expected ratio because inheritance events are random.
Can this calculator solve a two-trait genetic cross?
No. This page handles one gene at a time. For two genes or traits, open the Dihybrid Cross Punnett Square Calculator.
Related Genetics Tool
Dihybrid Cross Punnett Square Calculator – generate a 4 × 4 square for two traits and review gametes, genotypes, phenotypes and expected probabilities.
References
- OpenStax Biology 2e – Characteristics and Traits
- OpenStax Biology 2e – Laws of Inheritance
- MedlinePlus Genetics – Inheritance Patterns
Punnett Squares Show Probabilities, Not Guarantees
Each cell in a Punnett square represents a possible allele combination under the stated inheritance model. The proportions describe expected probabilities across many offspring; a small family can differ by chance. Dominance, linkage, sex linkage, incomplete penetrance, and more complex traits may require another model, so state the parental genotypes and assumptions with the result.