
Grade Curve Calculator
Calculate a curved grade using fixed points, highest-score curve, class-average curve, or square-root curve.
Curved Grade Results
This calculator provides estimated curved grades. Official grading may differ if your instructor caps curved scores, uses letter-grade cutoffs, applies a class distribution curve, drops questions, changes exam totals, or uses a custom grading policy.
A Grade Curve Calculator helps you see how a score changes when an instructor applies a specific grading adjustment.
The important word is specific. There is no single formula called “the curve.” One instructor might add five points to everyone, another might raise the highest score to 100, and another might use the class average or a mathematical transformation.
This calculator lets you model several common approaches while keeping the original score visible for comparison.
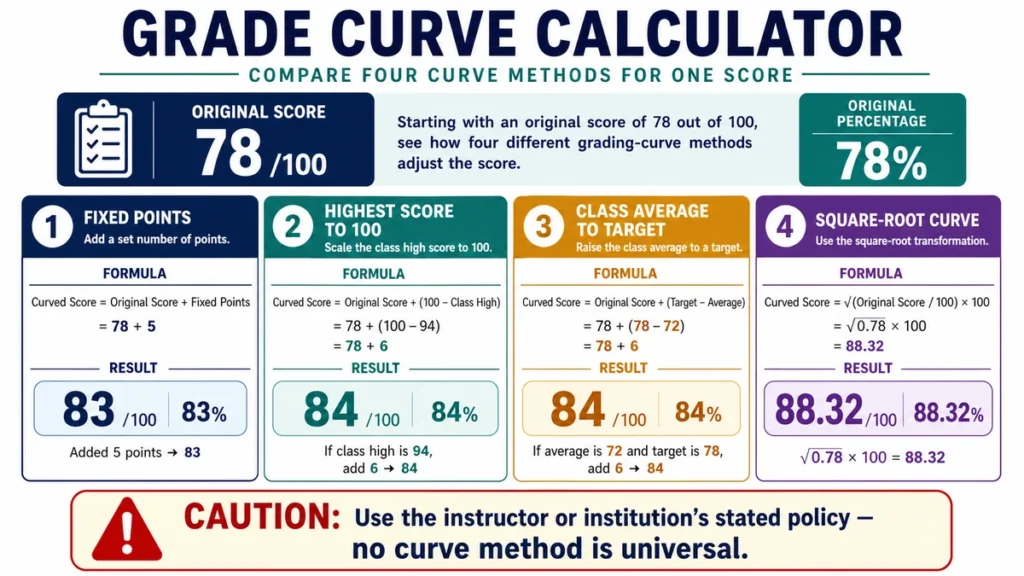
Use the method actually announced for the assessment rather than choosing the one that produces the highest result.
What Kind of Curve Are You Using?
Before entering numbers, find out how the adjustment is supposed to work.
The calculator can model four common methods:
| Curve Method | Basic Rule | Example |
|---|---|---|
| Fixed points | Add the same number of points | 81 + 5 = 86 |
| Highest score to maximum | Add the gap between the highest score and the maximum | Highest 94/100 → add 6 |
| Average to target | Add the gap between the current and desired class averages | 68 average → 75 target means +7 |
| Square-root curve | Transform the score using a square-root formula | 64/100 → 80/100 |
Each method answers a different question, so the calculator result only makes sense when the correct rule is selected.
How to Use the Grade Curve Calculator
Start with the original score and the maximum possible score.
Then choose the curve method your instructor or institution is using.
Depending on the method, you may also need to enter:
- a fixed number of points;
- the highest score in the class;
- the current class average;
- a target class average; or
- the information needed for the square-root transformation.
After calculating, compare the original and adjusted scores.
If the course has a maximum-score cap, rounding rule, or other special condition, apply that rule before treating the result as final.
Fixed-Point Curve
This is the simplest adjustment.
The same number of points is added to every score.
The formula is:
Curved score = Original score + Added points
For example, if you earned:
81
and the instructor adds:
5 points
then:
81 + 5 = 86
Your curved score is:
86
If the assessment maximum is 100 and the instructor caps scores at 100, a score such as 98 plus 5 would become 100 rather than 103.
Whether that cap exists depends on the grading policy.
Raising the Highest Score to the Maximum
Another method uses the highest score in the class.
Suppose the highest score was:
94 out of 100
The difference between the highest score and the maximum is:
100 − 94 = 6
If the rule is to add that same six-point difference to all scores, someone who earned 72 would receive:
72 + 6 = 78
The adjustment depends on the highest score, so make sure you use the correct statistic from the same assessment and class group.
Moving the Class Average to a Target
Some curves are based on the class average instead of the highest score.
Suppose the class average is:
68
and the instructor wants the adjusted average to be:
75
The difference is:
75 − 68 = 7
Under a simple additive version of this method, seven points are added to each score.
A student with:
72
would then receive:
72 + 7 = 79
This assumes the announced curve really is a uniform seven-point shift. An instructor may use a more complicated method to change the average, so follow the stated formula.
Square-Root Curve
A square-root curve raises lower and middle scores more strongly than scores already near the maximum.
For a 100-point assessment, a common version is:
Curved score = 10 × √Original score
For example, with an original score of:
64
the calculation is:
10 × √64
10 × 8 = 80
So:
64 becomes 80
Another example:
81 → 10 × √81 = 90
Notice that the increase is not the same for every student.
This is very different from adding a fixed number of points.
If the assessment maximum is not 100, the formula needs to be scaled appropriately rather than applied blindly to the raw score.
One Score Under Four Different Curve Methods
Suppose a student earns:
72 out of 100
and the class statistics are:
Highest score: 93
Class average: 66
Target average: 75
Fixed adjustment: +5
The same original score would change differently depending on the method:
| Method | Calculation | Adjusted Score |
|---|---|---|
| Fixed +5 | 72 + 5 | 77 |
| Highest to 100 | 72 + (100 − 93) | 79 |
| Average 66 → 75 | 72 + (75 − 66) | 81 |
| Square-root | 10 × √72 | 84.85 |
So the phrase “the exam is curved” is not enough information to calculate the adjusted score.
You need to know how the curve works.
Why the Curve Method Matters
The four example results above range from:
77
to:
84.85
from the same original score of 72.
That difference is not caused by arithmetic error. It comes from using different definitions of a curve.
A grade curve can:
- add the same amount to everyone;
- depend on the highest score;
- depend on a class statistic;
- apply a mathematical transformation; or
- change grade boundaries without changing numerical scores at all.
Always identify what the instructor means by “curve” before calculating.
A Curve Does Not Always Mean Extra Points
Students often use “curve” to mean that every score will increase.
That is not necessarily what happens.
An instructor could instead:
- change the letter-grade cutoffs;
- normalize a score distribution;
- rescale an assessment;
- replace one grading formula with another; or
- leave some scores unchanged.
The calculator models the methods it provides. It cannot infer an unannounced grading policy.
Apply the Curve Before Course Weighting
Suppose you earned:
72% on an exam
and the instructor officially curves that exam to:
79%
The exam is worth:
30% of the course
Use the curved exam score first:
79 × 0.30 = 23.7 course points
Do not simply add the seven curve points directly to your overall course grade.
Doing that would incorrectly make the curve much larger than intended.
Once the official curved score is known, you can place it into the Weighted Grade Calculator with the other course components.
Preserve the Original Maximum
A 45-point examination should not automatically be treated like a 100-point examination.
Suppose the highest score is:
41 out of 45
If the rule says to raise the highest score to the maximum, the adjustment is:
45 − 41 = 4 points
A student who earned 32 would receive:
32 + 4 = 36 out of 45
You could then convert that to a percentage if needed:
36 ÷ 45 × 100 = 80%
Using 100 as the maximum would produce the wrong adjustment.
Caps Can Change the Result
Suppose a fixed-point curve adds 8 points.
A student with:
96/100
would mathematically receive:
104/100
Whether the official result becomes 104, 100, or something else depends on the instructor’s rules.
Possible policies include:
- cap every score at the maximum;
- allow bonus scores above the maximum;
- cap only the final course grade;
- apply the curve before bonus credit; or
- use a separate rule for scores already near the top.
The calculator can show the arithmetic, but the grading policy decides which result is recorded.
Rounding Can Also Matter
Suppose a square-root curve produces:
84.8528
The instructor might record:
84.85
84.9
or:
85
depending on the rounding policy.
If that curved score later contributes to a weighted course grade, some gradebooks keep the full underlying precision and round only at the end.
When you are trying to reproduce an official grade, keep the unrounded result until you know how the system handles decimals.
Grade Curve vs Grade Boundaries
A curve does not always modify numerical scores.
An instructor might leave your 72% unchanged but change the letter-grade boundaries.
For example, instead of:
A = 90% and above
the instructor might decide:
A = 85% and above
In that case, your numeric percentage does not change at all.
Only its interpretation changes.
A score-adjustment calculator is not the right tool for that situation unless the grading rule can be expressed as a numerical transformation.
Grade Curve vs Percentile
A percentile tells you how your performance compares with other students.
A curve changes or interprets the score according to a grading method.
These are not the same thing.
For example, being in the 80th percentile does not mean your score will be curved to 80%, and scoring 80% does not mean you are in the 80th percentile.
Questions Worth Checking Before You Calculate
Before relying on a curved score, make sure you know:
Is the adjustment applied to every student?
Some rules may only affect particular score ranges.
Which class statistics are being used?
The curve might use your section, several sections combined, or a historical benchmark.
Are scores capped?
A mathematical result above the maximum may or may not be allowed.
When does rounding happen?
Rounding before weighting can produce a slightly different result from rounding at the very end.
Is the curve applied to points or percentages?
Adding five raw points to a 50-point exam is very different from adding five percentage points.
Does the gradebook apply it automatically?
If so, the official portal may be more reliable than a manual reconstruction once the curve has been posted.
Common Grade Curve Mistakes to avoid
Choosing the Curve That Gives the Best Result
The correct method is the one that matches the actual grading rule.
A calculator should reproduce policy, not choose the most favorable outcome.
Using the Wrong Class Average
If the instructor curves each section separately, an average from another section could produce the wrong result.
Treating Raw Points as Percentage Points
Adding 5 points to a 40-point exam is not the same as adding 5 percentage points.
A score of 30/40 becomes 35/40 under a five-raw-point adjustment:
35 ÷ 40 × 100 = 87.5%
The original 30/40 was 75%, so the increase is actually 12.5 percentage points.
Applying the Curve Directly to the Final Course Grade
Curve the assessment first, then apply its course weight.
Forgetting the Maximum Score
Several curve methods depend directly on the correct assessment maximum.
Rounding Before the Curve Is Finished
Keep full precision until the grading method tells you when to round.
Use the Result in the Rest of Your Grade Calculation
Once an official curve has been applied, you can continue with the adjusted score.
Use the Weighted Grade Calculator when the curved assessment is one part of a larger course grade.
Use the Marks Percentage Calculator if you first need to convert raw exam points into a percentage.
If the curved exam is your final assessment, the Final Grade Calculator can help you see how it affects the overall course result.
FAQ
What is a grade curve?
A grade curve is an adjustment or interpretation rule applied to assessment results.
It may add points, rescale scores, use class statistics, transform scores mathematically, or change grade boundaries.
Does a curve always increase every score?
No.
The effect depends on the method and the instructor’s policy.
Some methods may leave certain scores unchanged, cap results, or alter grade boundaries instead of changing the numeric score.
What is a fixed-point curve?
A fixed-point curve adds the same number of points to every score.
For example:
78 + 5 = 83
How does a highest-score curve work?
One common method calculates the difference between the highest observed score and the assessment maximum, then adds that difference to other scores.
For example, if the highest result is 94/100:
100 − 94 = 6
A score of 80 would become 86 under that rule.
What is a square-root curve?
On a 100-point scale, one common formula is:
Curved score = 10 × √Original score
For example:
64 → 80
The exact method should match the one specified by the instructor.
Can I use the class median instead of the average?
Only if the announced grading method uses the median.
Do not substitute one class statistic for another.
Which curve method is most accurate?
There is no universally correct curve.
The appropriate method is the one that reproduces the rule actually being used for the assessment.
Can a curved score exceed 100%?
Mathematically, yes under some methods.
Whether the recorded score is allowed to exceed 100% depends on the grading policy.
Should I curve the score before applying course weight?
Yes, when the instructor curves the individual assessment.
Calculate the official adjusted assessment score first, then apply its course weight.
Is the calculator’s curved score official?
No.
It is an estimate based on the selected method and inputs. The instructor or institution determines the official adjustment.
A Curve Is a Rule, Not a Guess
The Grade Curve Calculator becomes useful only after the adjustment method is known.
A score of 72 might become 77, 79, 81, 84.85, or something else entirely depending on the rule.
Keep the original score, use the correct assessment maximum, apply the announced method, and preserve any cap or rounding policy.
The purpose of the calculator is to reproduce the curve transparently—not to search for the formula that gives the most favorable grade.