
Plastic Footprint Calculator
Enter how many plastic items you use, choose the timeframe for each, then click Calculate.
Food & Kitchen
Bathroom & Laundry
Disposable Containers & Packaging
Plastic Footprint
Step-by-step derivation
| Item | Items / year | g each | Subtotal (kg) |
|---|---|---|---|
| Enter values and click Calculate to see the breakdown. | |||
| Total | — | ||
References
- PET bottle model weight: 20 g each
- Plastic bag model weight: 5.5 g each
- Straw model weight: 0.55 g each
- Annualization factors used: day × 365, week × 52, month × 12, half-year × 2, year × 1
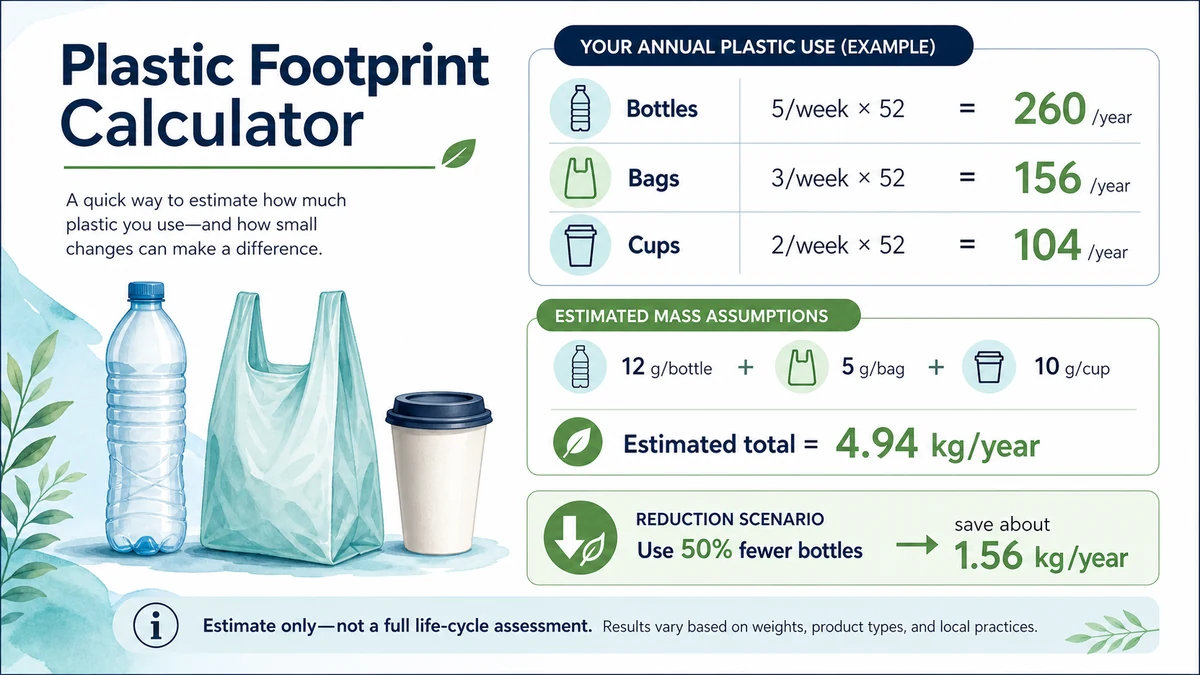
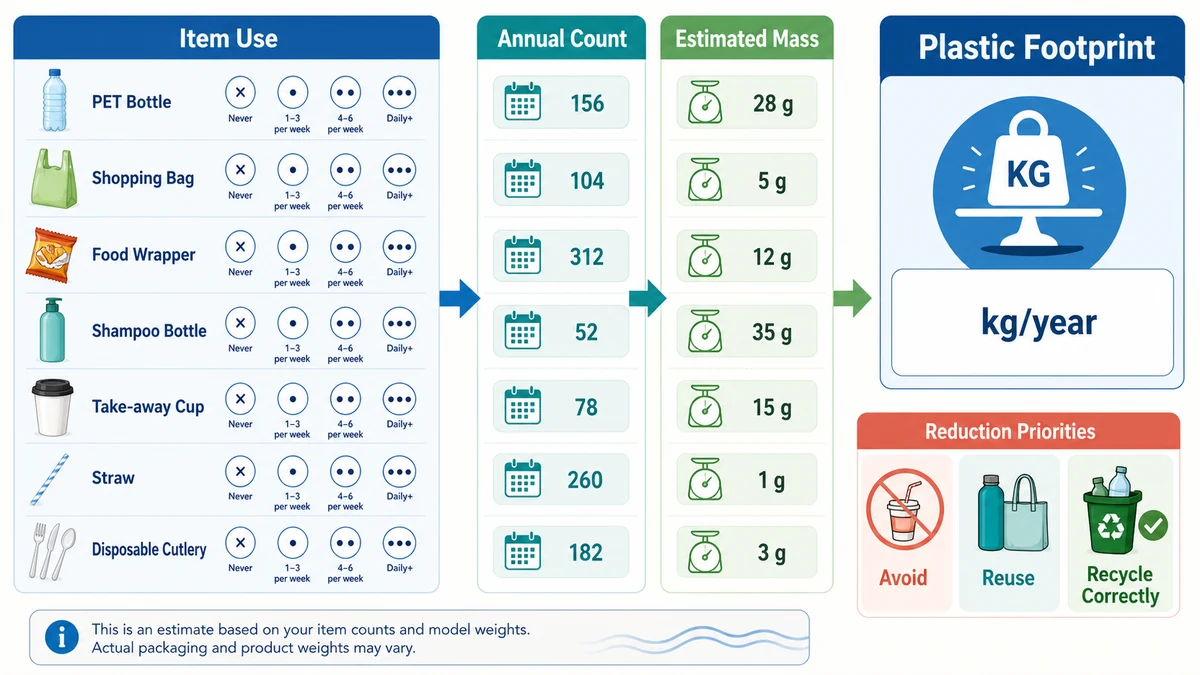
A useful plastic-reduction plan starts with a measurable baseline rather than a vague impression. This Plastic Footprint Calculator annualizes the bottles, bags, wrappers, personal-care packaging, take-away containers, and disposable items you report, then estimates their combined plastic mass in kilograms and pounds per year. It helps reveal which repeated habits contribute most, while keeping the assumptions visible.
How to use the plastic footprint calculator
Enter how many of each listed item you use and select whether that quantity occurs per day, week, month, half-year, or year. Leave genuinely unused categories blank or at zero. Click Calculate to see the annualized item counts, estimated mass by category, total kilograms per year, and pounds per year.
Use a typical recent period rather than an unusually busy or quiet week. Purchase history, household receipts, workplace records, or a short waste audit can improve recall. If several people share the items, decide whether the estimate represents one person or the whole household and record that scope beside the result.
Plastic footprint calculation method
The first step converts each frequency to an annual count:
Annual items = Entered quantity × Timeframe factor
The calculator uses 365 for daily use, 52 for weekly use, 12 for monthly use, 2 for half-year use, and 1 for yearly use. Each annual count is then multiplied by the model weight assigned to that item:
Annual item mass = Annual items × Estimated grams per item
Finally, all item masses are added and converted:
Total kg/year = Σ annual item mass in grams ÷ 1,000
The pound result is a unit conversion of the same estimated mass. It is not a separate environmental-impact score.
Worked plastic-use example
Suppose one person uses one 20 g PET bottle each day and five 5.5 g plastic bags each week. Bottles contribute 365 × 20 g, or 7,300 g per year. Bags contribute 5 × 52 × 5.5 g, or 1,430 g per year. Together they total 8,730 g, equal to 8.73 kg per year.
This example shows why frequency can matter as much as individual item weight. A lightweight object used hundreds of times can outweigh a heavier item purchased rarely. The category breakdown is therefore more actionable than the total alone: it identifies where a realistic substitution or refill habit could have the greatest effect.
What the result measures—and what it does not
The result estimates the mass of selected plastic items used during a year. It does not directly measure plastic sent to landfill, litter leakage, recyclability, toxicity, greenhouse-gas emissions, microplastic release, marine impact, or a complete product life cycle. Recycled packaging still counts as plastic use in this mass baseline, although its material history and end-of-life pathway may differ.
The United Nations Environment Programme describes a life-cycle approach to plastic pollution that considers production, design, use, reuse, and disposal. Use the calculator as one practical measurement within that broader picture, not as a claim that every kilogram has identical consequences.
Why item weights are estimates
Actual packaging mass varies by brand, size, thickness, closure, label, multilayer construction, and product redesign. A 500 mL bottle may not weigh the same as a large detergent bottle even when both are classified as bottles. The model values make quick comparisons possible but cannot replace weighing representative empty items.
For a more accurate audit, collect clean examples, remove nonplastic contents when appropriate, and weigh several units with a suitable scale. Average the observed item weights, then multiply by annual counts outside the preset model or document an adjusted calculation. The mean, median, and mode calculator can summarize repeated weight measurements when packages vary.
Build a reliable household baseline
A one- to four-week tracking period often captures routine purchases better than memory alone. Record item type, quantity, date, household size, and whether the item was avoided, reused, recycled, composted where accepted, or discarded. Seasonal items and occasional bulk purchases may need a longer review.
Repeat the audit with the same scope after a change. The percentage change calculator can compare old and new totals, but a reduction is meaningful only if both periods cover similar people, activities, and durations. Keep the category details so a lower total cannot be mistaken for missing data.
Turn the estimate into reduction priorities
Start with categories that combine high annual mass, frequent use, and an achievable alternative. Avoid unnecessary items where possible, choose durable reusables that will actually be used repeatedly, refill compatible containers, select products with less packaging, and buy appropriate quantities. A substitution is useful only when it fits hygiene, safety, accessibility, and local conditions.
The U.S. Environmental Protection Agency advises that preventing waste in the first place is the most effective approach and offers practical plastic waste reduction and reuse actions. Set one or two measurable changes, such as reducing disposable bottles per week, then recalculate after a defined period.
Recycling requires local instructions
A resin number identifies plastic type but does not guarantee that the item belongs in a local curbside program. Shape, color, size, film construction, contamination, and market capability affect acceptance. Bags and flexible films often need separate collection, while compostable plastics can disrupt conventional recycling when placed in the wrong stream.
Check the rules of the local collector or municipality. Empty, rinse, separate, or replace caps only as instructed. Recycling can help manage material already used, but it should not be treated as permission to ignore avoidable single-use consumption. Reduction and reuse typically address material demand earlier in the life cycle.
Comparing people or households fairly
Total household kilograms naturally increase with household size. For a simple per-person comparison, divide the same household total by the number of residents covered by the observations. The percentage calculator can also show which item category contributes the largest share of the total.
Comparisons remain approximate because the calculator includes selected common items rather than every plastic product. Clothing fibers, electronics, furniture, building materials, vehicles, medical products, and industrial packaging are outside its scope. The result is most valuable as a repeatable personal baseline, not a universal ranking.
Common mistakes to avoid
- Entering a weekly quantity while leaving the timeframe set to daily.
- Counting a multipack as one item when the calculator expects individual pieces.
- Mixing one person’s use with whole-household categories.
- Assuming every bottle, bag, or container has the preset model weight.
- Subtracting recycled items even though the metric measures plastic used.
- Interpreting kilograms of selected items as a full carbon or pollution footprint.
Related environmental calculation
The Shannon Diversity Index Calculator measures species diversity from ecological abundance data. It answers a different question, but both tools show why transparent inputs, consistent measurement, and cautious interpretation matter in environmental analysis.
Frequently asked questions
What is a plastic footprint?
Here, it means the estimated annual mass of selected plastic items used, based on reported frequency and model item weights. Other definitions may cover wider life-cycle impacts.
Does recycling reduce the calculator result?
No. The tool estimates plastic use, so an item still counts even if recycled. Track recycling separately when evaluating end-of-life handling.
How accurate are the item weights?
They are approximate model values. Actual products vary. Weigh representative empty items and use purchase records when a higher-accuracy audit is needed.
Should I enter household or personal use?
Either scope works if applied consistently. Record who is included so later comparisons use the same boundary.
How can I reduce my plastic footprint?
Prioritize high-frequency or high-mass categories, avoid unnecessary items, use durable reusables, choose refills or less packaging, and follow local recycling rules.
Is this the same as a carbon-footprint calculator?
No. It estimates plastic mass, not greenhouse-gas emissions. A life-cycle carbon calculation requires production, transport, use, and disposal data for each product.
Focus on Repeat Purchases and Avoided Waste
A plastic-footprint estimate is most useful for identifying recurring sources such as packaging, bottles, delivery materials, and disposable household items. Record a typical week or month, distinguish product weight from packaging weight, and avoid assuming every item has the same disposal outcome. Prioritize feasible reductions, reuse, and local recycling guidance rather than chasing false precision in the total.